A picture is worth a thousand words.
Build a dashboard in minutes
Gather your company's key information by neatly building it on a dashboard.
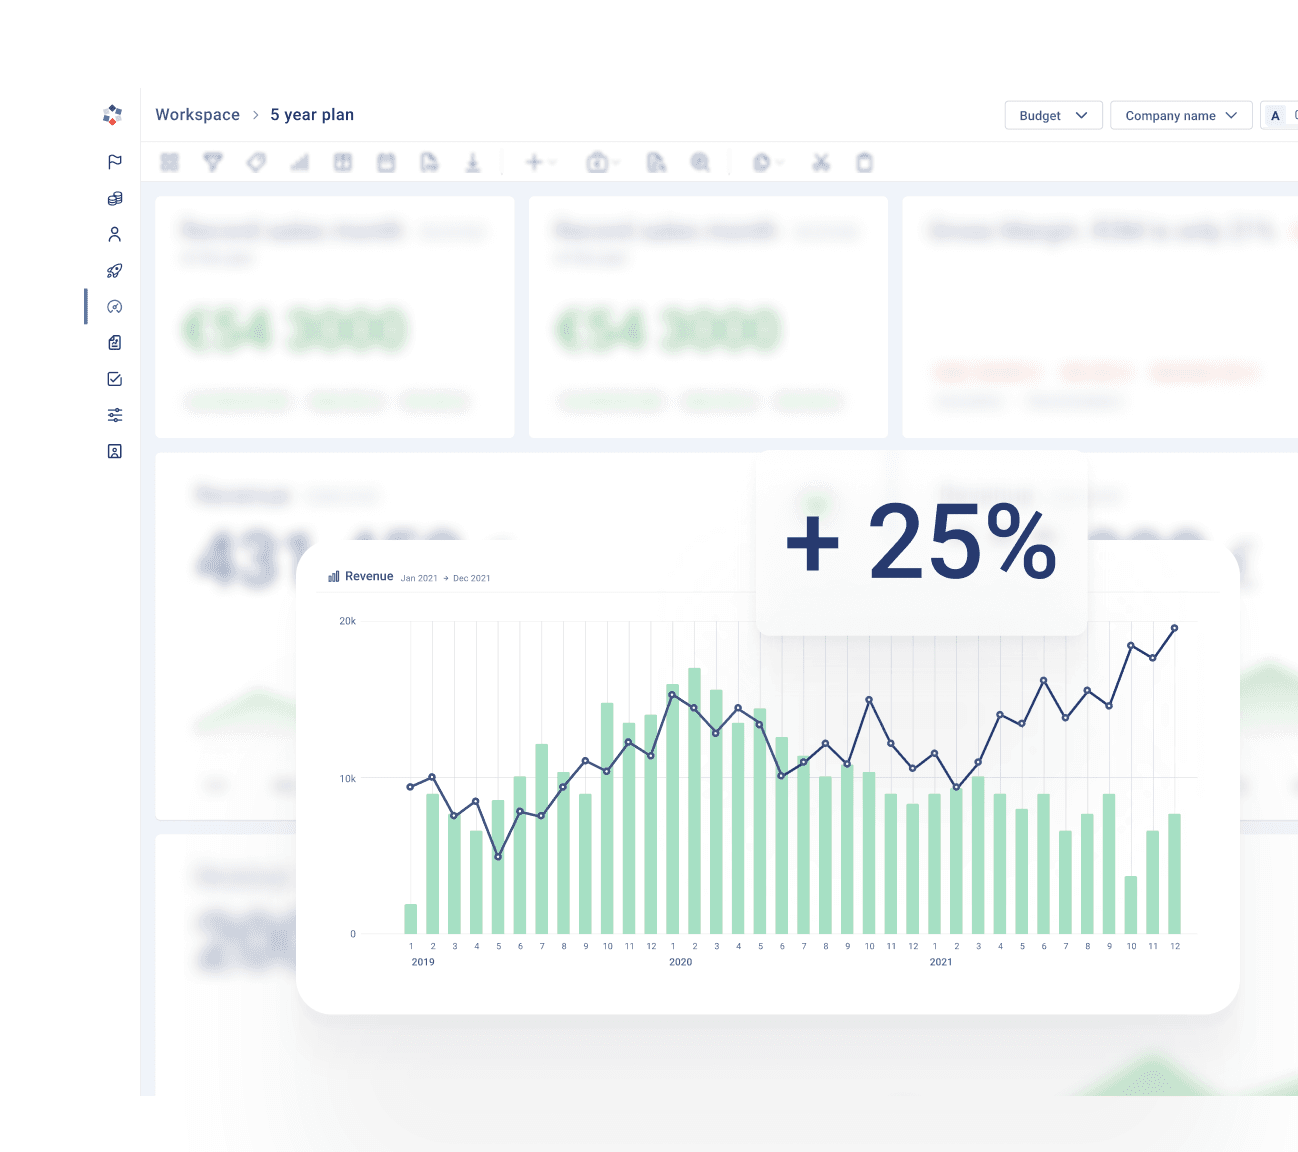
Monitor the cash flow forecast implementation in charts
The projected development of cash flow is easier to conceptualize in a line chart.
Compare the actuals to the budget in a bar chart.
A significant deviation from the budget requires planning for corrective actions.
Compare the budget and the latest forecast as a chart.
The latest estimate provides the best information at any given moment on how the current fiscal year will turn out.
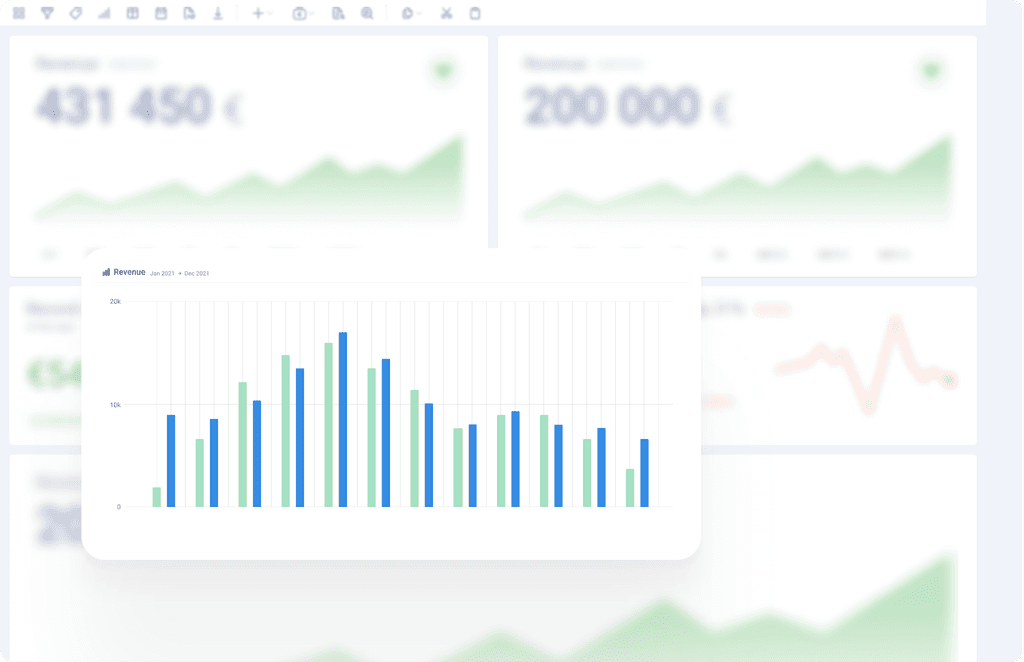
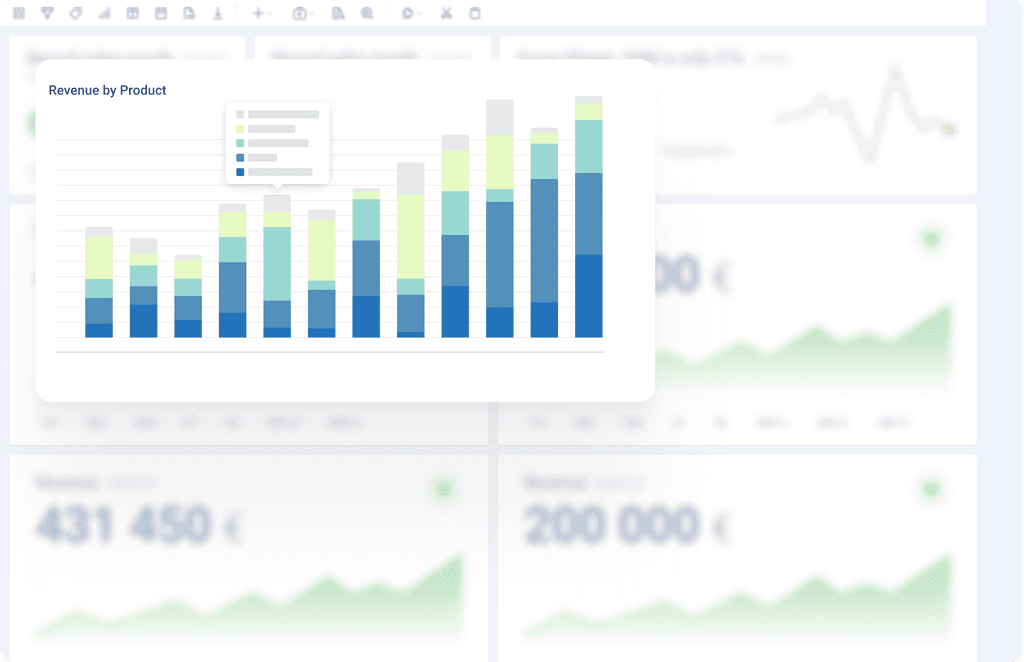
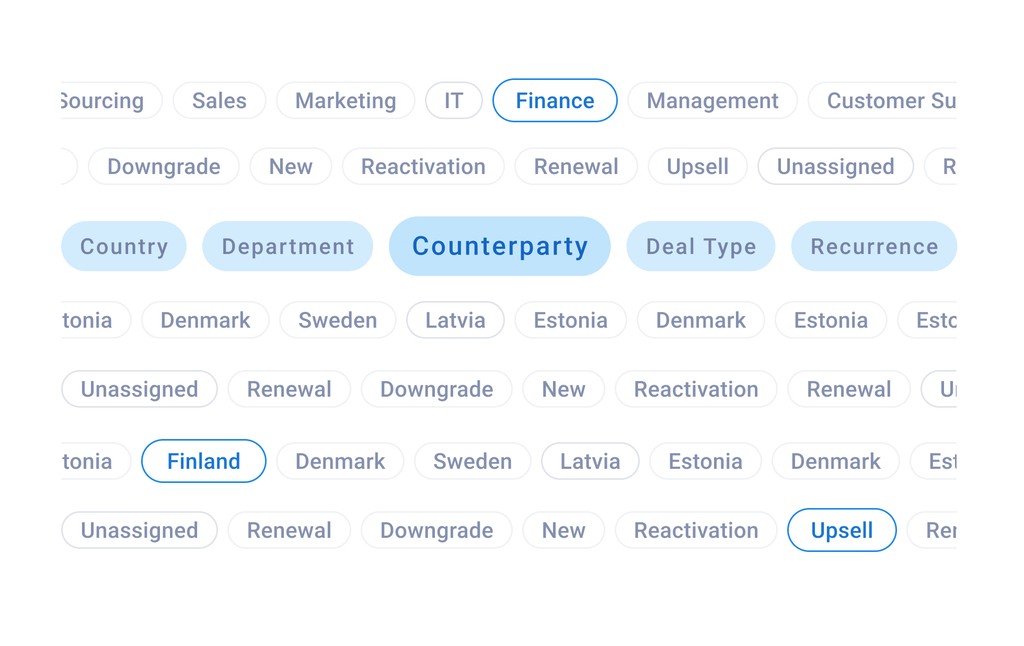
Present the revenue by product in a breakdown chart.
Choose the breakdown of revenue in your preferred way. By customers, by products, by product groups, or even by geographical area.
Observe the cash runway from the graph
Follow the clearly marked cash runway and identify potential cash bottlenecks. Accurately assess future income and expenses for the cash flow.
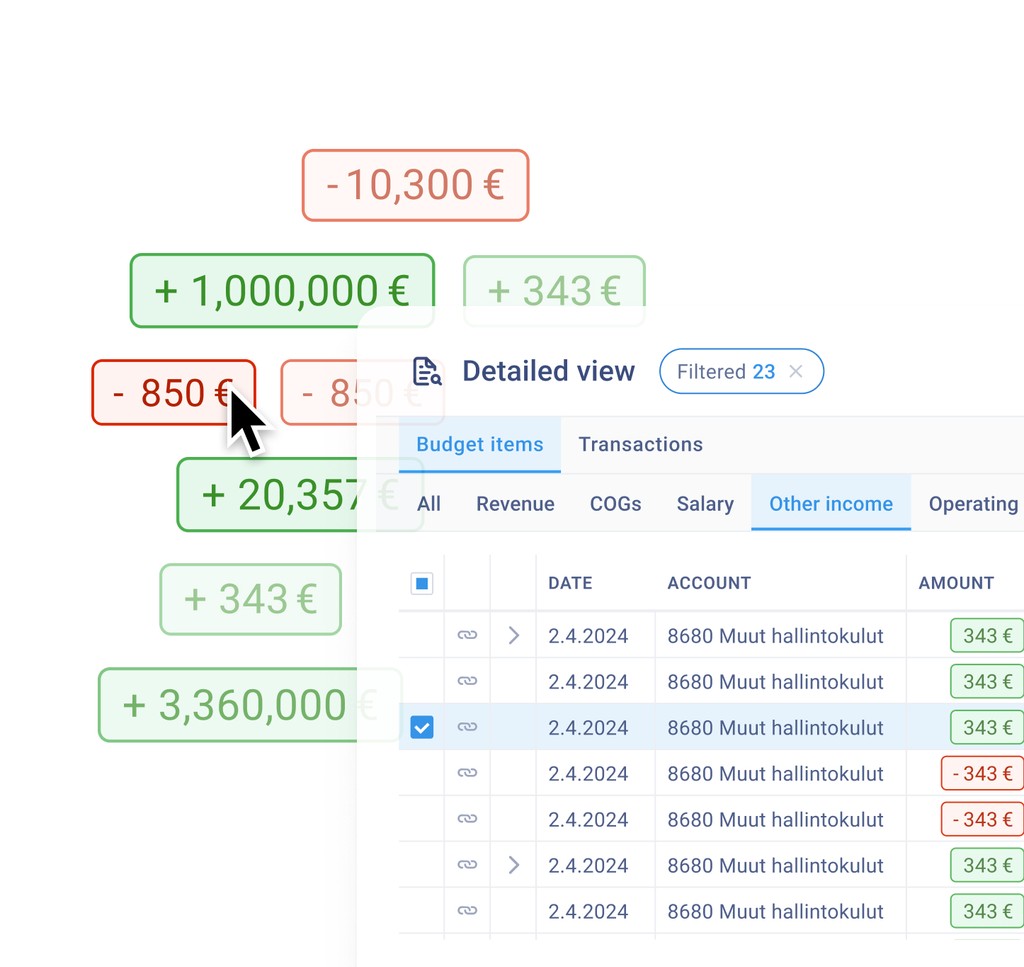
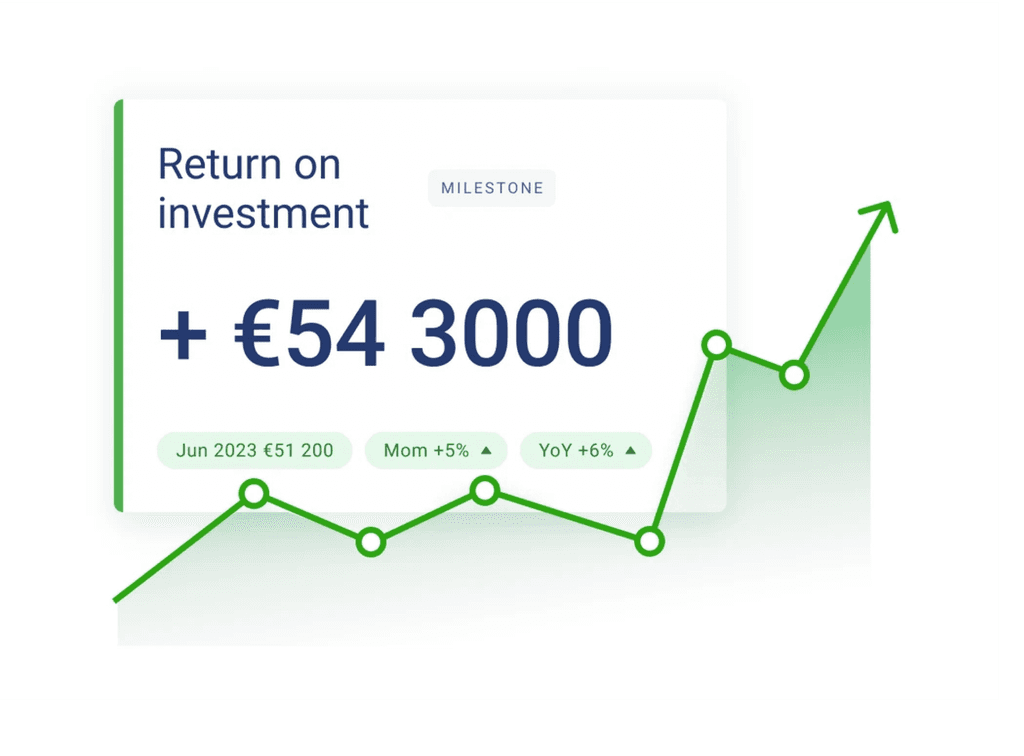
Analyze and monitor the KPI
Define your desired KPIs and track them visually.
Identify trends and variations with charts
Visualization helps to understand changes and key factors for the change.
CASH FLOW
Present the revenue by product in a breakdown chart.
Valitse haluamasi erittely liikevaihdolle ja näe se pinottuna pylväskaavioina
Tunnista parhaiten ja heikoiten menestyvät tuotteet tai asiakasryhmät.
Suodata halutut tuotteet tai asiakasryhmät kaaviossa
Havaitse ajoissa trendit tuotteissa tai asiakasryhmissä.
KPI
Observe the cash runway from the graph
Näe helposti lisääntyykö runway vai lyheneekö
Tunnista mahdolliset kassakapeikot hyvissä ajoin
Ajoita investoinnit oikein, kun tiedät kassavirran tulevaisuudessa.
Aloita rahoituskierros riittävän ajoissa, ennen kuin joudut vaikeaan asemaan rahoitusneuvotteluissa
Viesti runwaysta sidosryhmille helposti ymmärrettävästi

KPI
Analyze and monitor the KPI
Seuraa KPI-tavoitteiden toteutumista reaaliajassa
Tunnista trendit ja poikkeamat KPI:ssä ja suunnittele korjaavat toimenpiteet ajoissa
Follow the progress towards the goals